Summary
The purpose of this study was to compare the accuracy of Nonin PureSAT® Signal Processing Technology against the “gold standard” of co-oximetry during patient motion. Additionally, comparative accuracy data under the same condition was obtained from a current model of another leading “next generation” pulse oximetry manufacturer. Data was obtained from human subjects using a standard desaturation protocol at the UCSF Hypoxia Research Laboratory in San Francisco, California, in January of 2005. Results of the testing demonstrate that the Nonin PureSAT Signal Processing Technology was the most accurate over all tested levels of saturation during patient motion. The Nonin data is consistent with previously published non-motion data, assuring the user of consistent, quality information for motion or non-motion conditions alike.
About the Study
The study was conducted using a standard protocol of rapid arterial desaturation in healthy, non-smoking, consenting adult subjects at the Hypoxia Research Laboratory of the University of California San Francisco. A pool of seven males and five females with skin tones ranging from light to dark were included in this study. Each subject was placed in a semi-supine position and allowed to breathe through a mouthpiece while the nose was blocked by a nose-clip. Hypoxia was induced by having subjects breathe mixtures of nitrogen, room air and carbon dioxide, with each desaturation level held in a stable plateau. Each experiment consisted of two runs of five plateaus of oxyhemoglobin saturation between 60% and 100%. The level of oxyhemoglobin saturation was maintained at each plateau until the pulse oximeter readings stabilized and arterial blood samples were obtained. Two blood draws from an arterial cannula were taken sequentially during a stable plateau and analyzed by a co-oximeter which is the “gold standard” for measuring arterial oxygen saturation. Inspired O2 concentration was adjusted breath-by-breath using a computed saturation based on end-tidal PO2 and PCO2 as sampled by a SpO2 and mass spectrometer. SpO2 and pulse rate data were recorded every second using a laptop computer.
Rubbing and tapping motions were created by means of an industry-wide accepted protocol for generating motion.
Systems Tested
The system labeled as “A” is the Nonin OEM III module, with the 8000AA PureLight® sensor. System “B” is a currently marketed pulse oximeter from another leading manufacturer of pulse oximeters with motion-tolerant claims. The reference or “gold standard” is the Radiometer OSM-3 multi-wavelength co-oximeter.
Analysis and Definition
The measurement of accuracy is presented as the Arms value, and was calculated according to the latest draft of ISO 9919, Standard Specification for Pulse Oximeters.
Terms
Arms (RMS) – Accuracy measurement calculated as the square root of the sum of the bias squared and the standard deviation of the bias squared (√ (BIAS2 + SD2)). Typically referred to as the “RMS” figure of merit. This is the current method required by the FDA for the representation of pulse oximetry accuracy data.
N (n) – The number of samples used to calculate the mean bias, standard deviation, and Arms value.
Results
Accuracy – Tables 1 through 3 on the following page report the number of samples and RMS values for both pulse oximeter devices tested over the entire range from 60% to 100% SaO2, over the specified range of 70% to 100%, and then broken down by decade. The Nonin OEM III showed the best accuracy in terms of RMS value, and the most consistent by decade (Table 3) as compared to System B. In the decades below 80%, Nonin performance is consistent throughout the decades, while System B’s performance degrades, as shown by RMS values.

Table 1: Accuracy for SaO2 Greater or Equal to 60% (Motion)

Table 3: Accuracy by SaO2 Decade (Motion – Tapping & Rubbing)
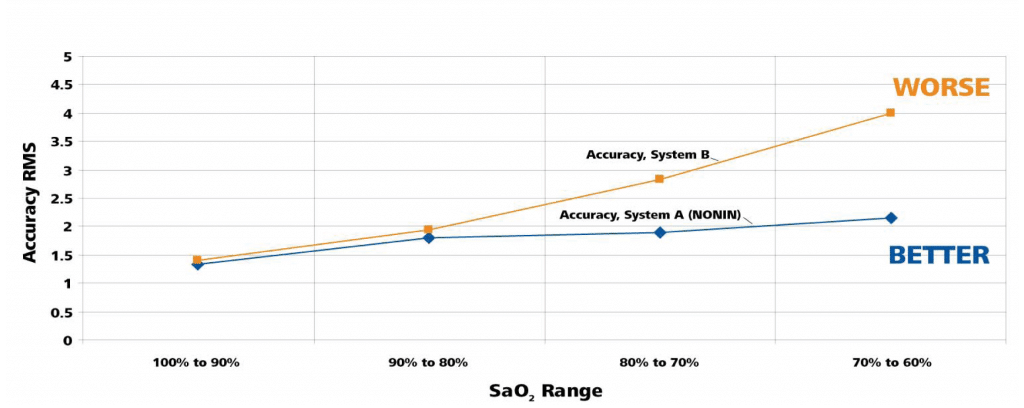

Comparison of Accuracy in Motion
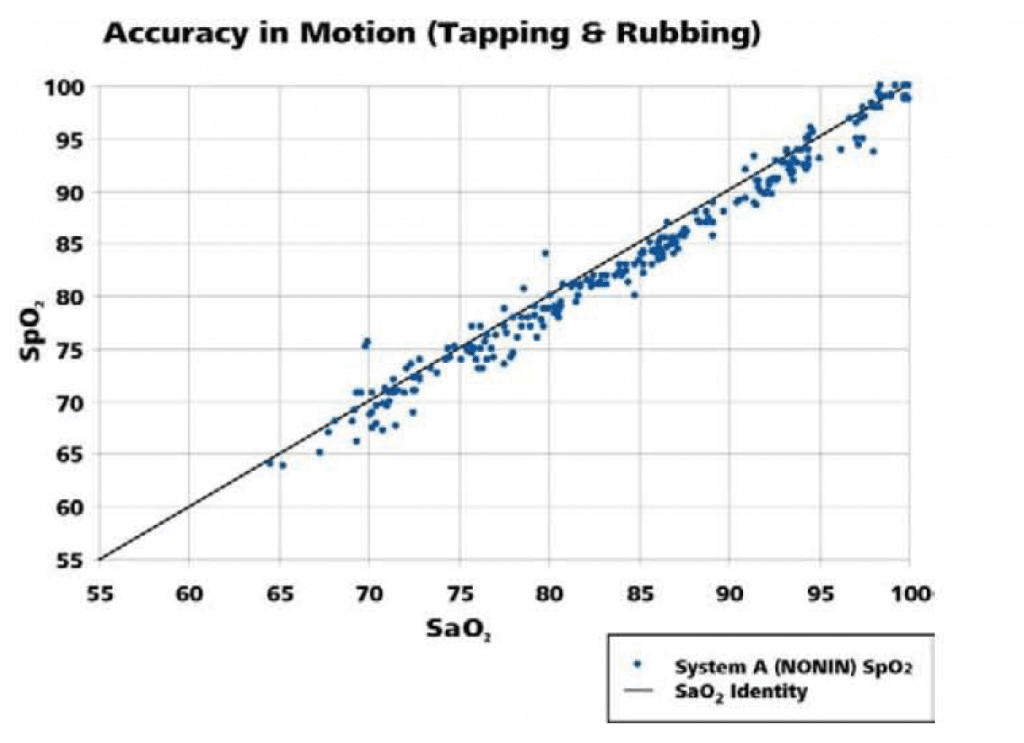
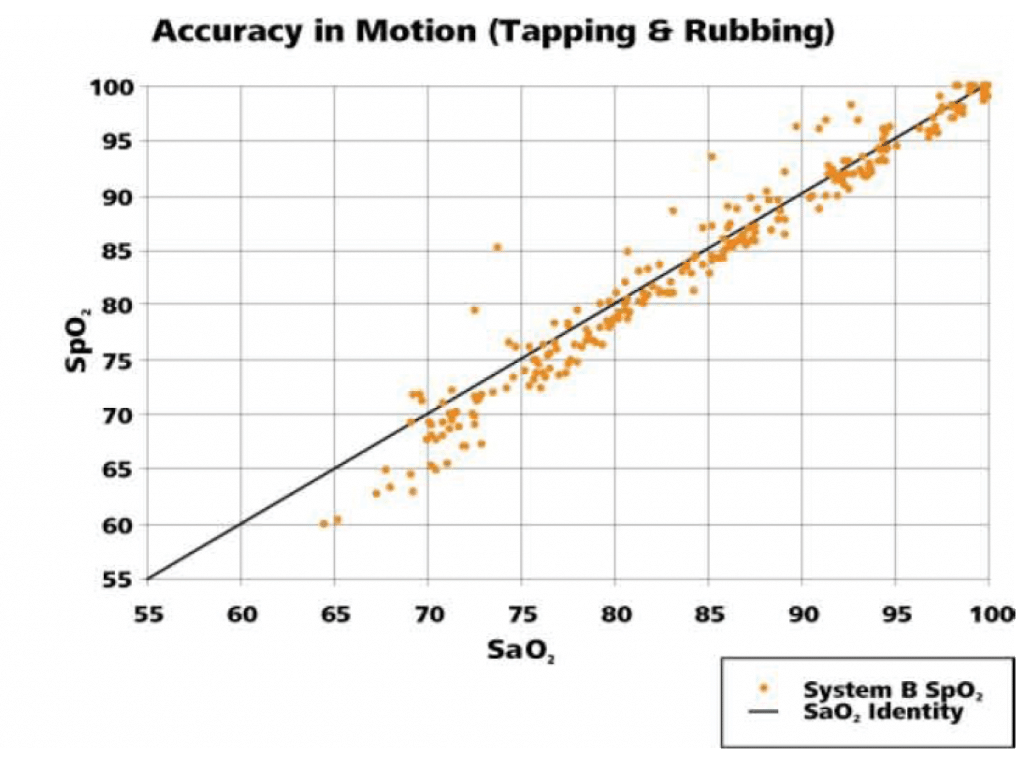
The following graphs (Figures 3, 4) illustrate the correlation of SpO2 data to the SaO2 data as measured by co-oximetry.

Additional Observations of Individual Subject Data
The following analysis of individual subject data shows the accuracy and responsiveness of each device during a desaturation event in a challenging motion environment. Evaluation of this performance showed several instances in which the Nonin product tightly tracked changes in saturation in close correlation to the co-oximeter, while the other product either overshot the actual value, or struggled to respond to the changes in saturation with a more sluggish response. The effect of this performance is that at times, System B saturation levels were over represented (as with an overshoot lower than the co-oximetry value), as well as under represented (when it displayed values higher than the actual co-oximeter reading). Two individual files of desaturation data plotted against the co-oximeter values are shown.
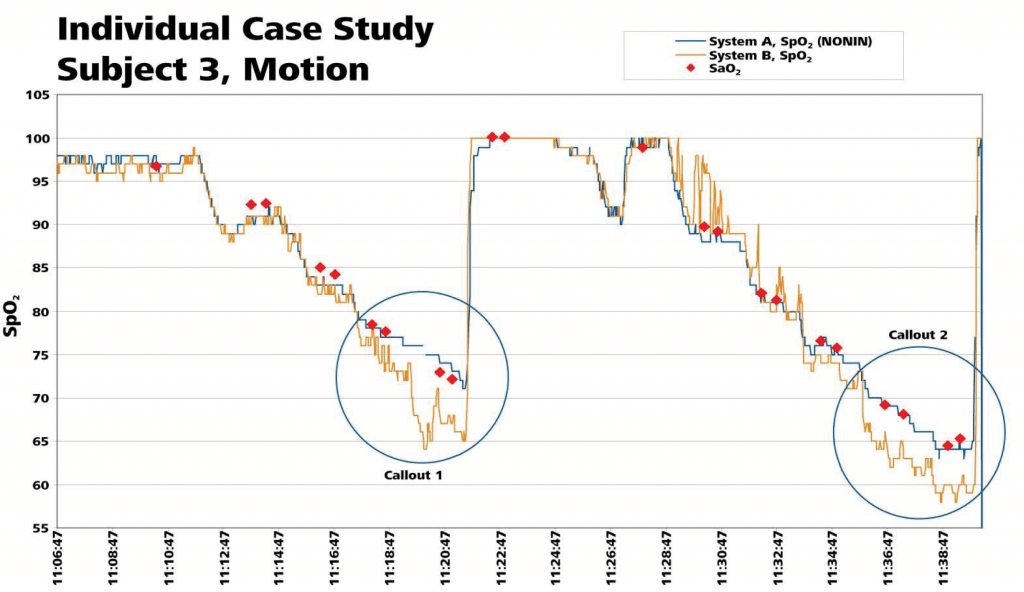
Callout 1: No Misleading Data with Break in Usable Signal
Nonin’s PureSAT® Signal Processing Technology identified that the pulse signals were unusable, and momentarily suspended readings (as shown by gap in Nonin trace). System B continued to use the signals and reported a false low reading that was 8 points lower than both the SaO2 blood draw value and the System B SpO2 reading from the non-motion hand.
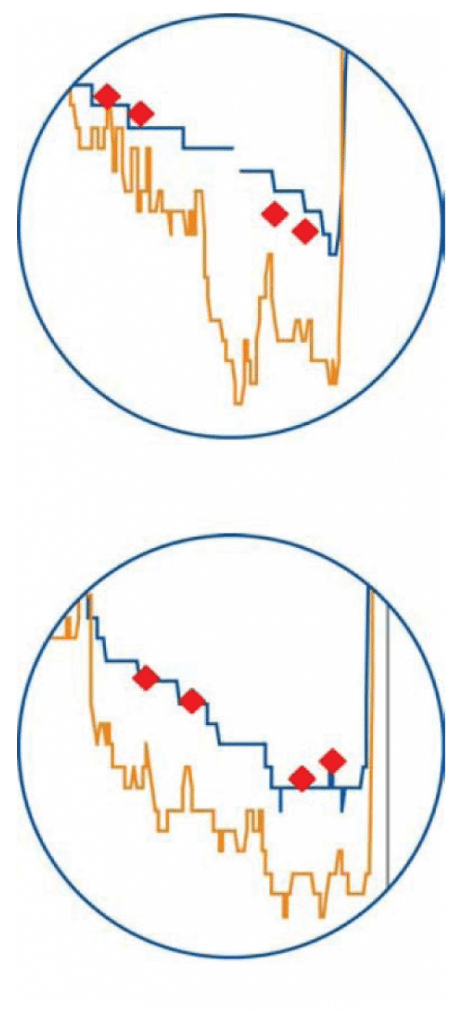
Callout 2: False Low Reading
Notice in this desaturation event that the Nonin system is tracking in close correlation with the true values of the co-oximeter. System B overestimates the desaturation and shows values much lower than the true subject values as the desaturation progresses.
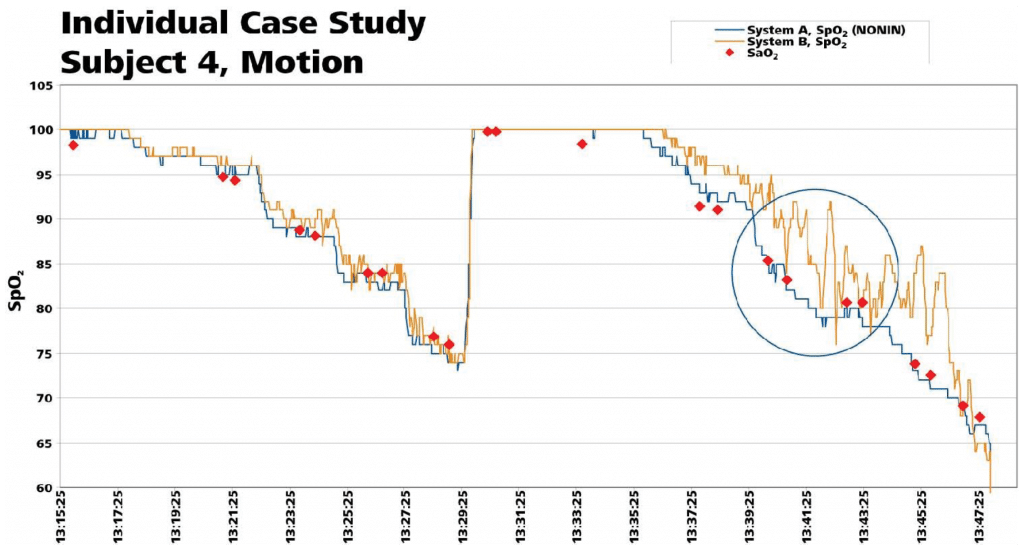
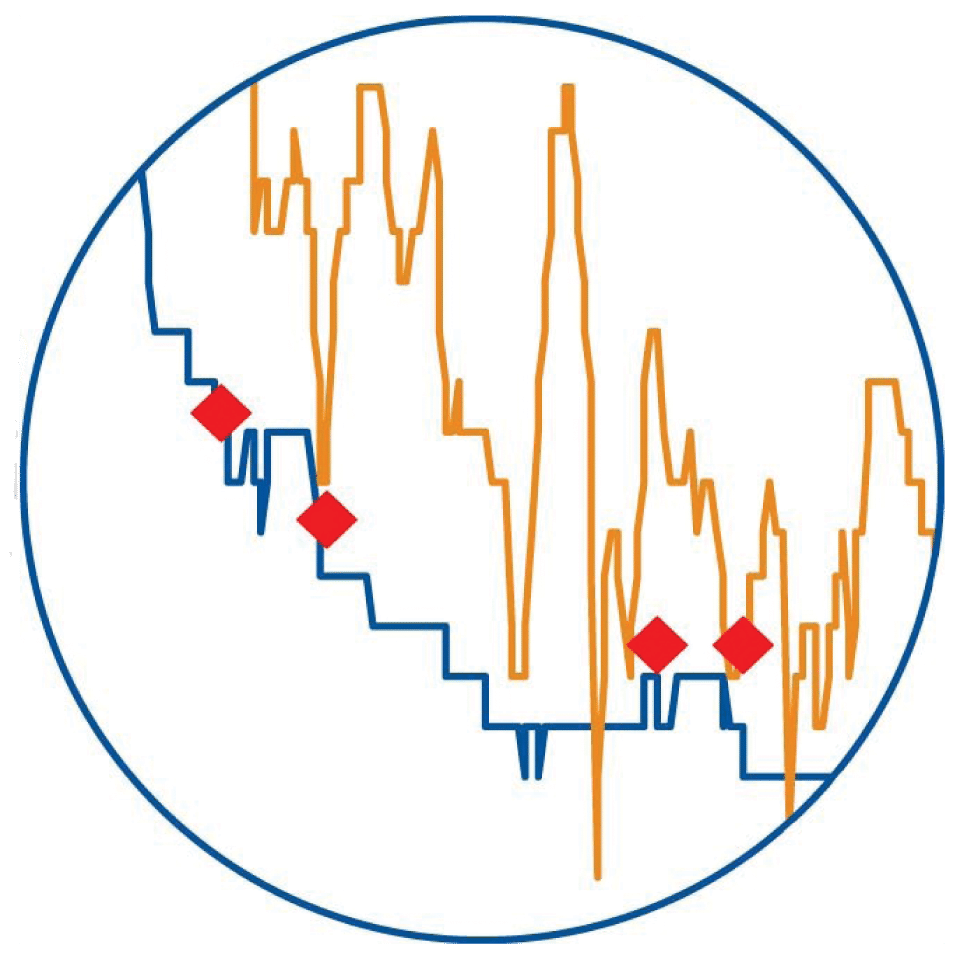
Callout 3: False High Reading
During this desaturation event the Nonin system closely correlates with the co-oximeter values, while system B takes far longer to respond and rarely gets close to the actual measured value, showing a false high reading for this subject.
The Nonin Performance Difference
Nonin’s PureSAT® Signal Processing Technology provides superior oxygen saturation and pulse rate data through its proven ability to distinguish “real” pulses from motion artifact. Nonin PureSAT makes greater use of the most valuable pulse signal waveforms by decreasing the occurrence of false desaturation events and false alarms. Through identification of the best and most reliable signals on a pulse-by-pulse basis, users are provided with accurate information and the fastest response time to physiological changes.
Nonin’s PureLight® Sensor Technology provides only the purest red and infrared LEDs to create unparalleled accuracy – especially at critical SpO2 levels. Nonin’s PureLight LEDs hold a steady calibration curve, even at SpO2 levels below 80%, where reliable information is even more critical.
The combination of the Nonin PureSAT Signal Processing Technology and PureLight Sensor Technology provides a highly responsive and precise system for accurate and reliable readings, even under the most challenging patient conditions.
